
Infographics With a Magazine Feel
Generate an editorial-style infographic — serif display headlines, muted sophisticated palette — from a prompt in about a minute.
Sign in, new accounts get 10 free credits.
Made with this style
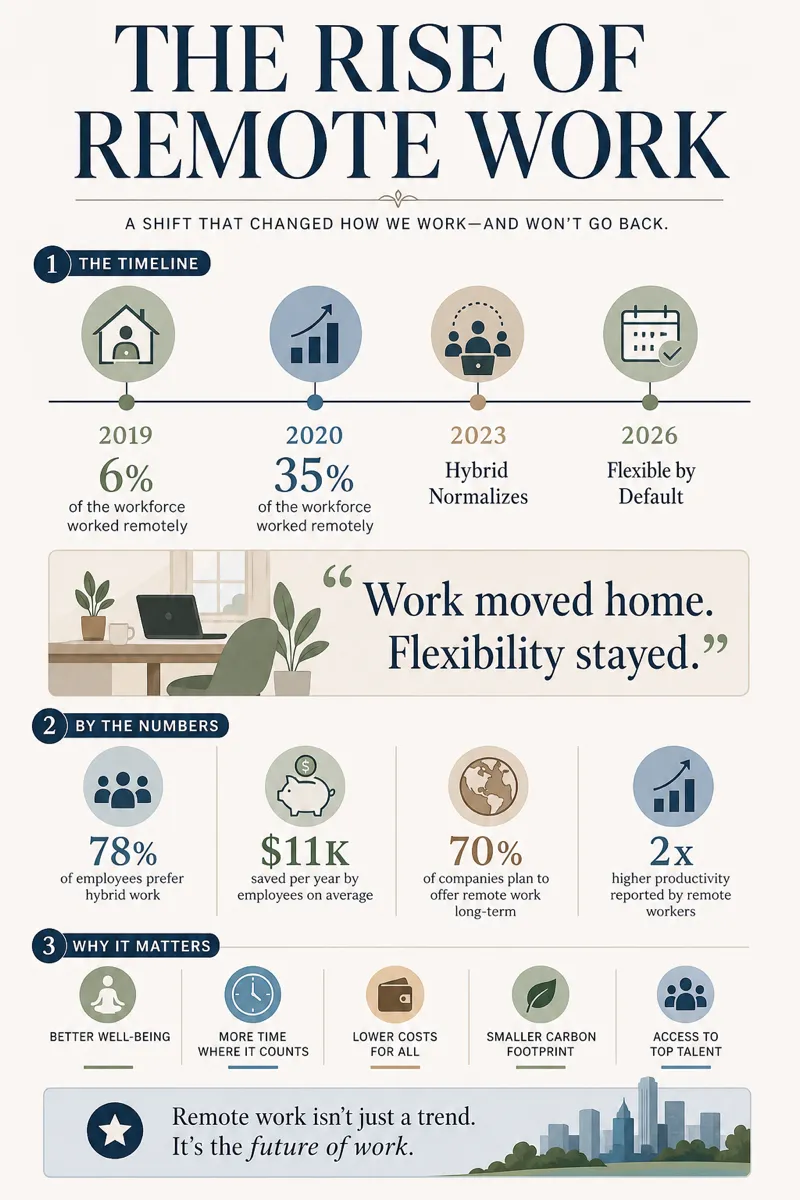
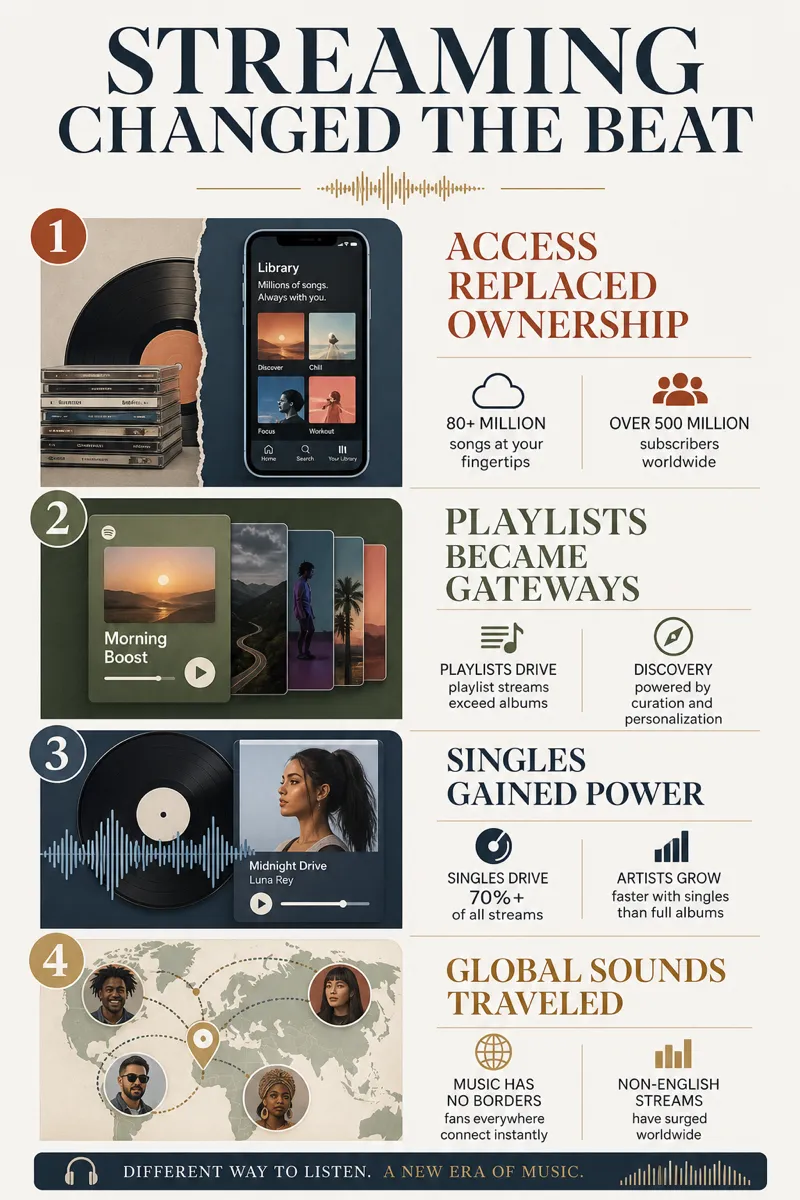
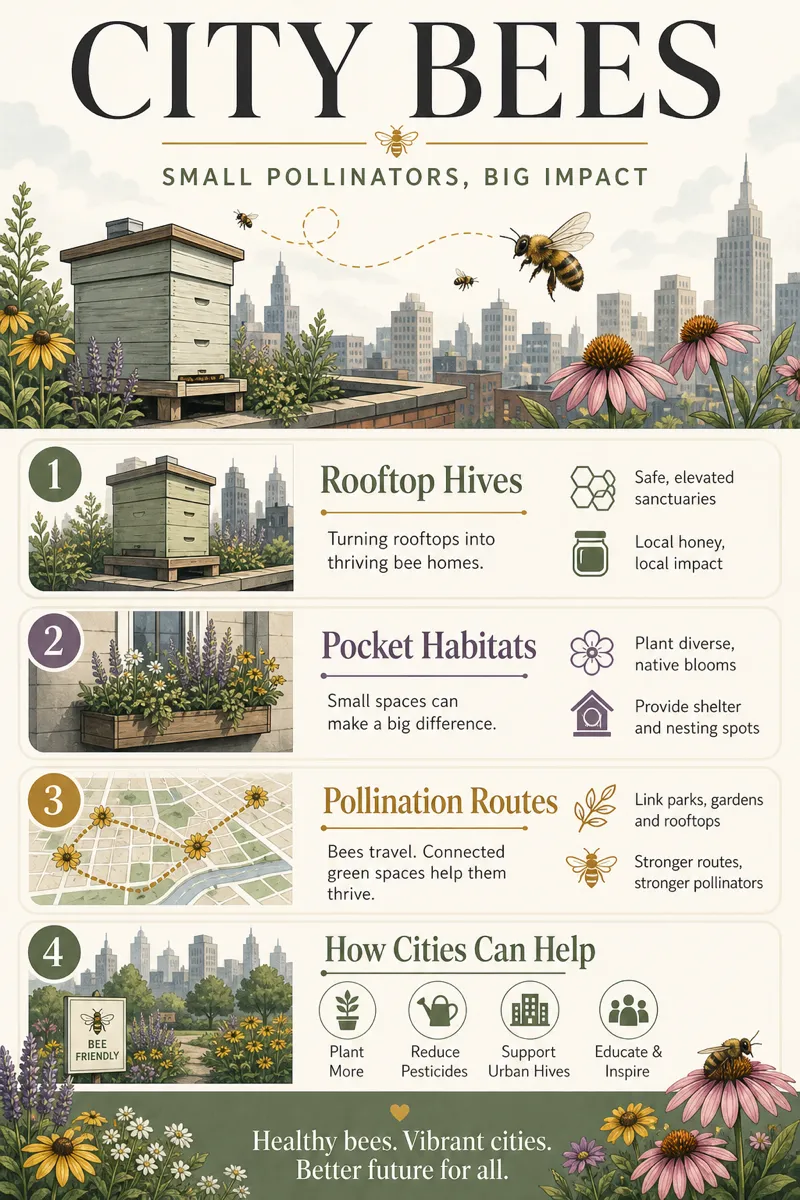
How it works
Start from a text prompt, choose the shape and style, and generate a complete infographic. Then ask for specific changes to the wording, colors, or layout until the result is ready to use.
- 01
Describe
Write what you want in plain language — the topic, the facts, the vibe.
- 02
Generate
Get a polished infographic in about a minute, in the aspect ratio you picked.
- 03
Refine
Change colors, wording, or layout with simple instructions — every version is kept.
What is an editorial infographic?
Editorial style borrows from magazine layout: serif display headlines, a muted and sophisticated color palette, and a more literary sense of composition than a typical business chart. It suits long-form articles, thought-leadership content, newsletters, cultural and lifestyle brands, and any piece meant to be read rather than glanced at. Writers, publications, and brands with a more considered voice use it when a corporate or flat style would feel too transactional.
Describe the argument, data, or narrative you want visualized, and Infolustra composes a complete editorial-style infographic in about 60 seconds, choosing typography and a muted palette that read like a printed page. If the headline, color, or composition needs adjusting, send a follow-up instruction and the same piece updates. Switch to a different style whenever the piece needs a different tone.
Editorial style rewards a strong headline and a clear point of view — serif typography carries more weight here than in other styles, so words matter as much as layout. Keep the palette to two or three muted tones rather than bright colors, which fight the magazine feel. Compared with corporate style, built for clarity and speed, editorial is built for a slower read — use corporate for a business deck, editorial for a piece meant to be published.
Frequently asked questions
Make your first infographic
Describe an idea, generate it in about a minute, and refine it until it looks exactly right.