
Isometric Infographics in One Minute
Generate isometric 3D infographics — consistent 30-degree grid, soft shadows, real depth — from a plain-text prompt in about a minute.
Sign in, new accounts get 10 free credits.
Made with this style
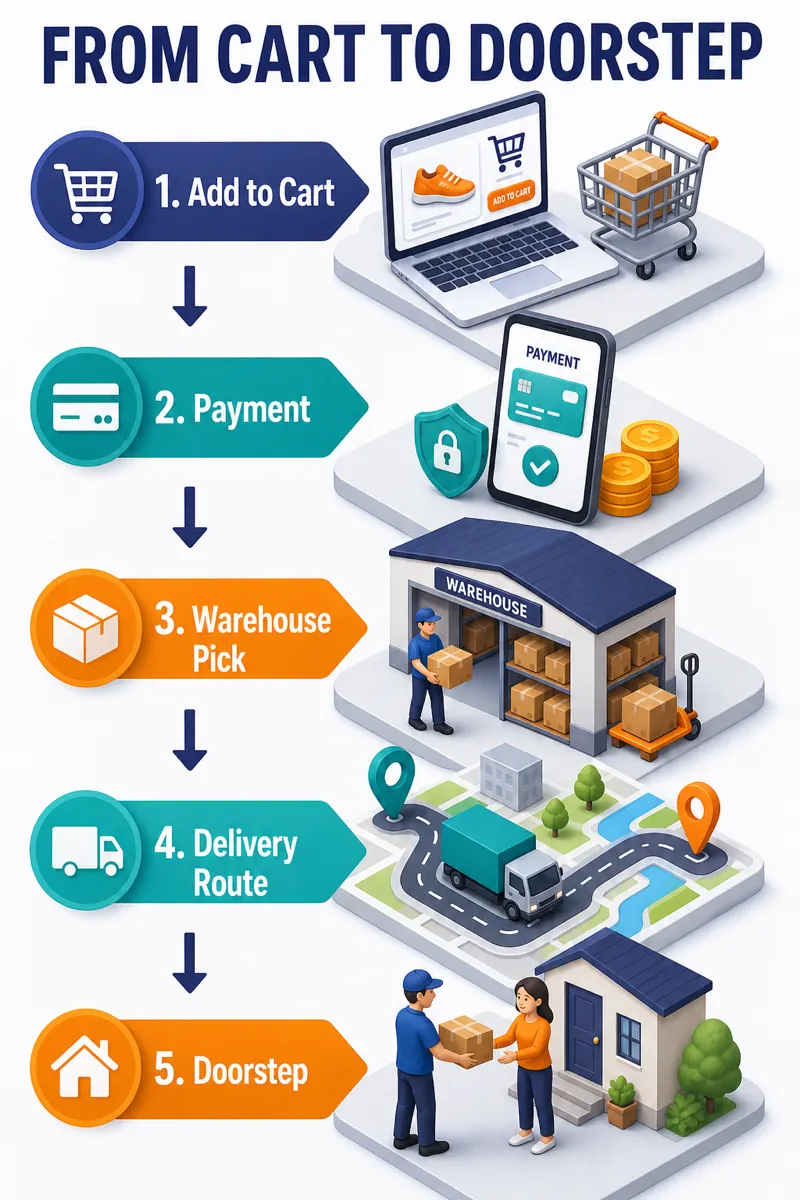
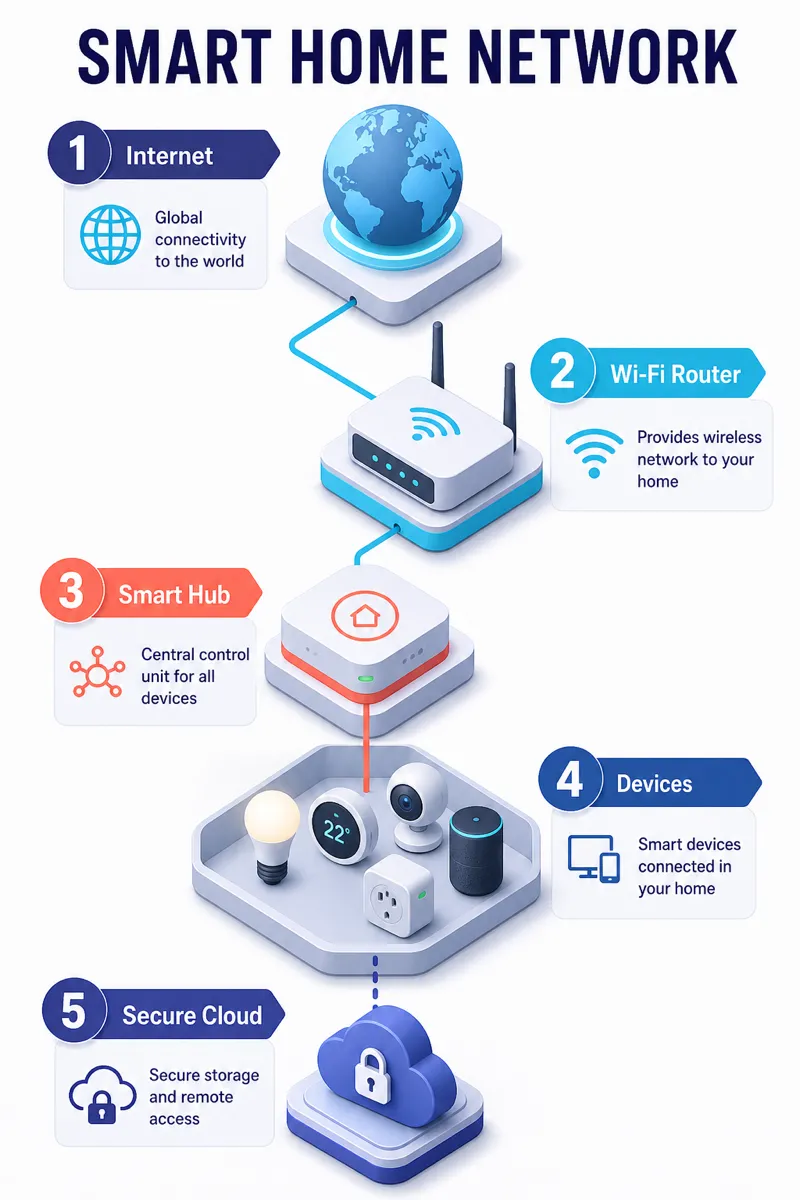
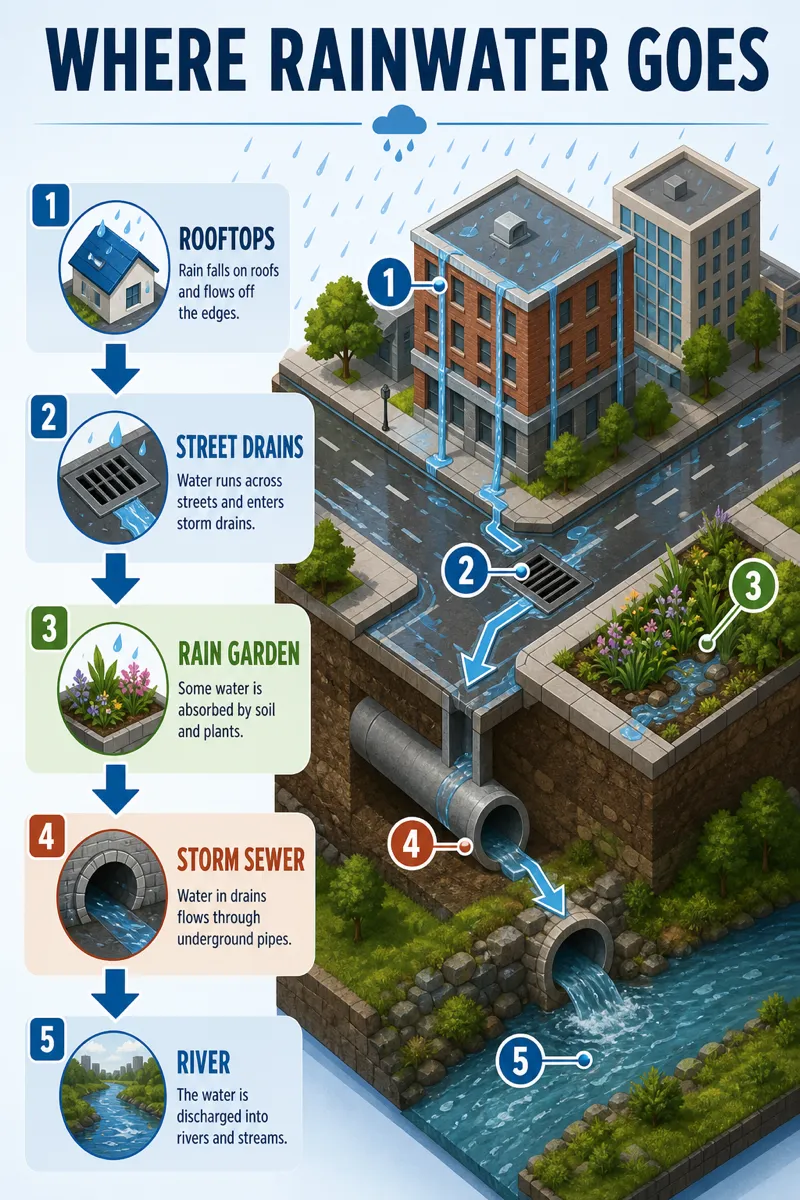
How it works
Start from a text prompt, choose the shape and style, and generate a complete infographic. Then ask for specific changes to the wording, colors, or layout until the result is ready to use.
- 01
Describe
Write what you want in plain language — the topic, the facts, the vibe.
- 02
Generate
Get a polished infographic in about a minute, in the aspect ratio you picked.
- 03
Refine
Change colors, wording, or layout with simple instructions — every version is kept.
What is an isometric infographic?
Isometric style renders flat shapes on a consistent 30-degree grid with soft shadows, giving charts and diagrams a sense of depth without full 3D rendering. It works well for system architecture diagrams, office or warehouse layouts, product breakdowns, and step-by-step processes where showing how pieces stack or connect matters more than plain statistics. Tech teams, real-estate and logistics businesses, and SaaS products documenting how a system fits together tend to reach for it first.
Describe the process, system, or space you want illustrated, and Infolustra builds a complete isometric infographic in about a minute, keeping every object aligned to the same grid and light source. If an element needs adjusting — a different building, a reordered step, a new label — send a follow-up instruction and the image updates in place. You can switch to a different style at any point without losing the underlying content.
Isometric works best with distinct, blocky objects — boxes, buildings, servers, devices — rather than organic shapes, since the grid is what sells the illusion of depth. Keep the object count moderate; past six or seven pieces the perspective starts to feel cluttered. Compared with flat design, which keeps everything on one plane, isometric adds a spatial relationship between elements — use it when position and connection matter, and flat when a quick scan is the only goal.
Operations teams use isometric graphics to explain warehouse flow, and technical teams use them to show how services, devices, or facilities connect. A logistics diagram can place packing, loading, and delivery in one spatial scene; a network overview can separate users, gateways, and data stores by layer. In the prompt, list the objects in their physical or logical order and ask for one consistent viewpoint. Perspective becomes confusing when every object implies a different camera angle.
Frequently asked questions
Make your first infographic
Describe an idea, generate it in about a minute, and refine it until it looks exactly right.