


Timelines
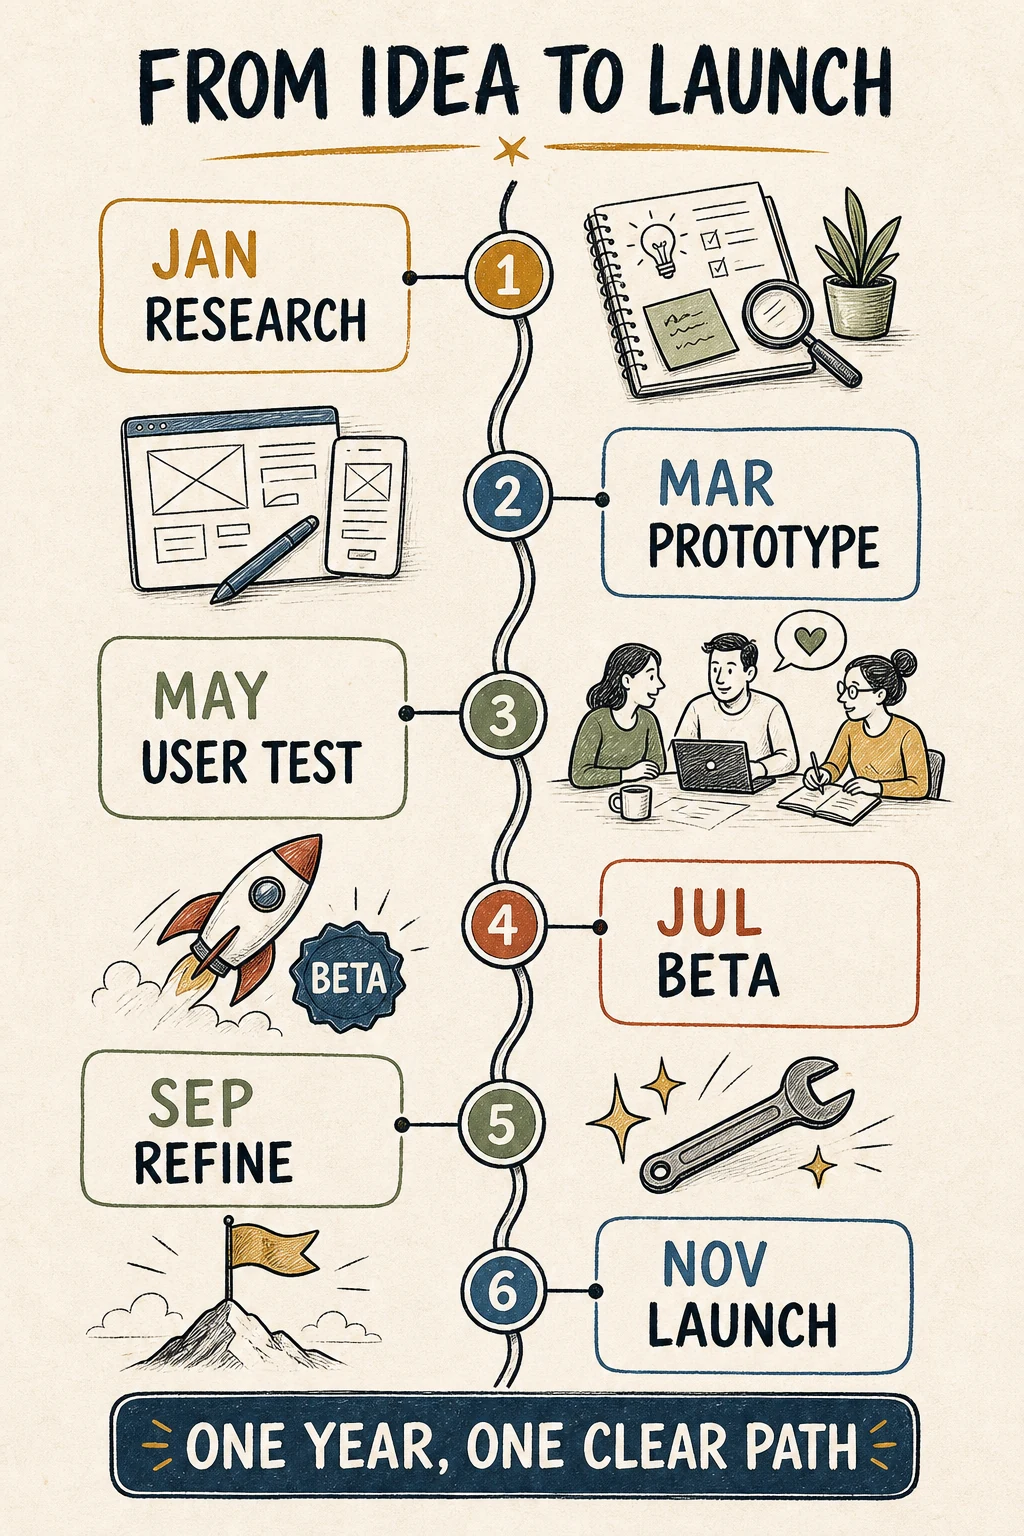
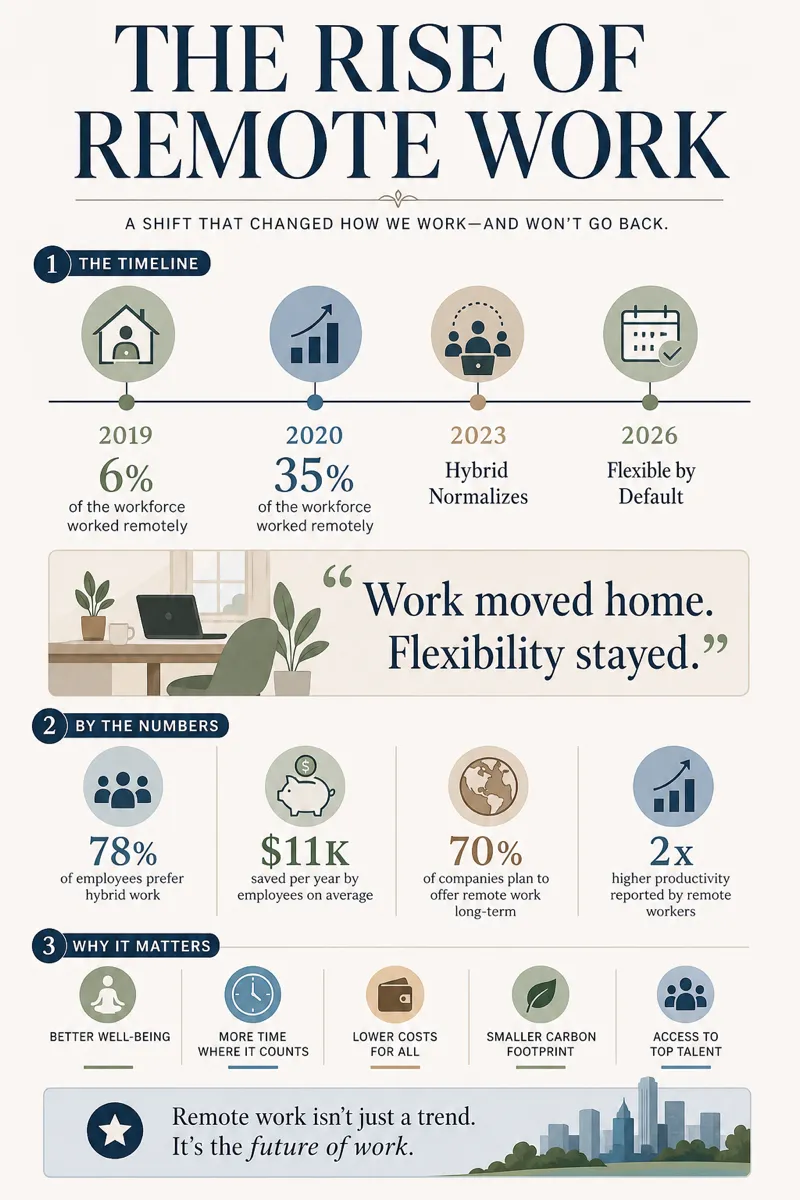
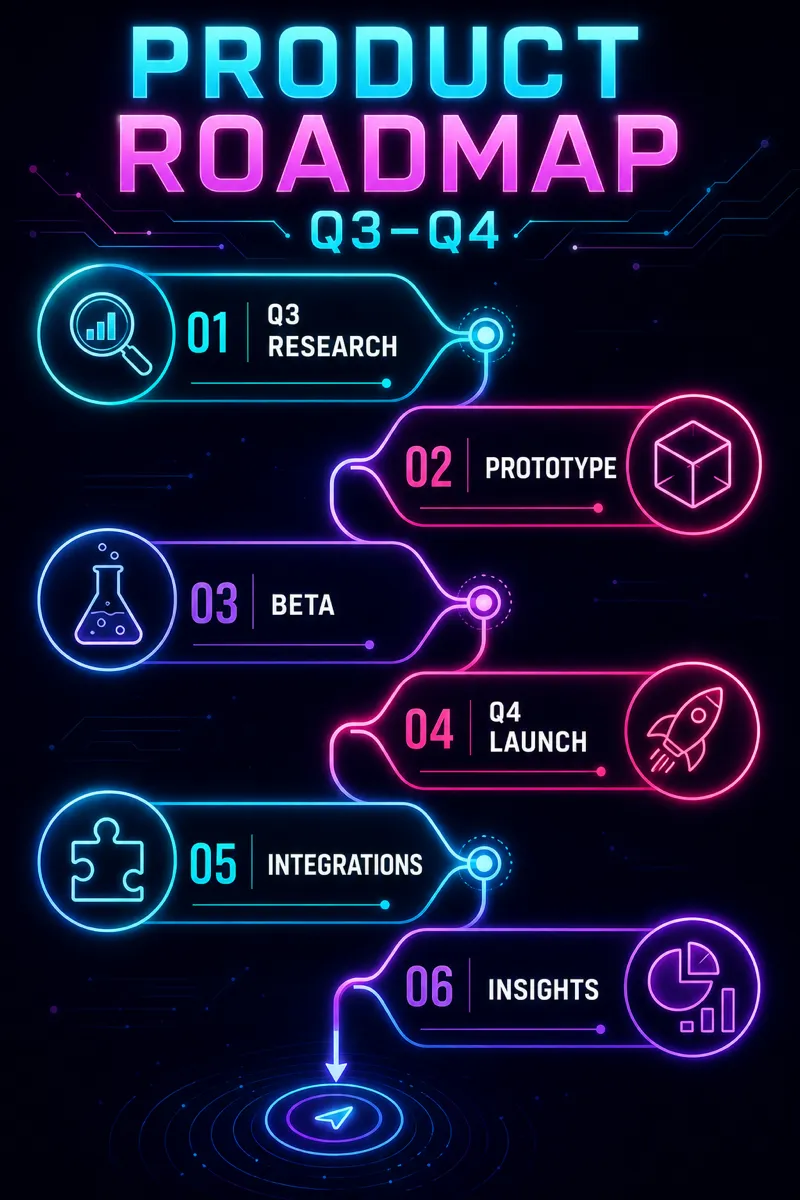
Turn dates and events into a visual sequence for history lessons, product roadmaps, or company milestones. Ask the generator to shorten labels or emphasize the moments that matter most.
Turn text into a polished infographic — then keep editing it until it's right.
A free AI infographic generator that turns plain text into designed infographics — no templates to wrestle, no design skills needed.
Sign in, new accounts get 10 free credits.
Choose a ready-made visual direction, then add your content and generate.
Start from a text prompt, choose the shape and style, and generate a complete infographic. Then ask for specific changes to the wording, colors, or layout until the result is ready to use.
Write what you want in plain language — the topic, the facts, the vibe.
Get a polished infographic in about a minute, in the aspect ratio you picked.
Change colors, wording, or layout with simple instructions — every version is kept.
Use Infolustra when useful information is trapped in notes, documents, or a rough outline. Describe the structure you need, generate a first visual, and refine the result with follow-up instructions.
Turn dates and events into a visual sequence for history lessons, product roadmaps, or company milestones. Ask the generator to shorten labels or emphasize the moments that matter most.
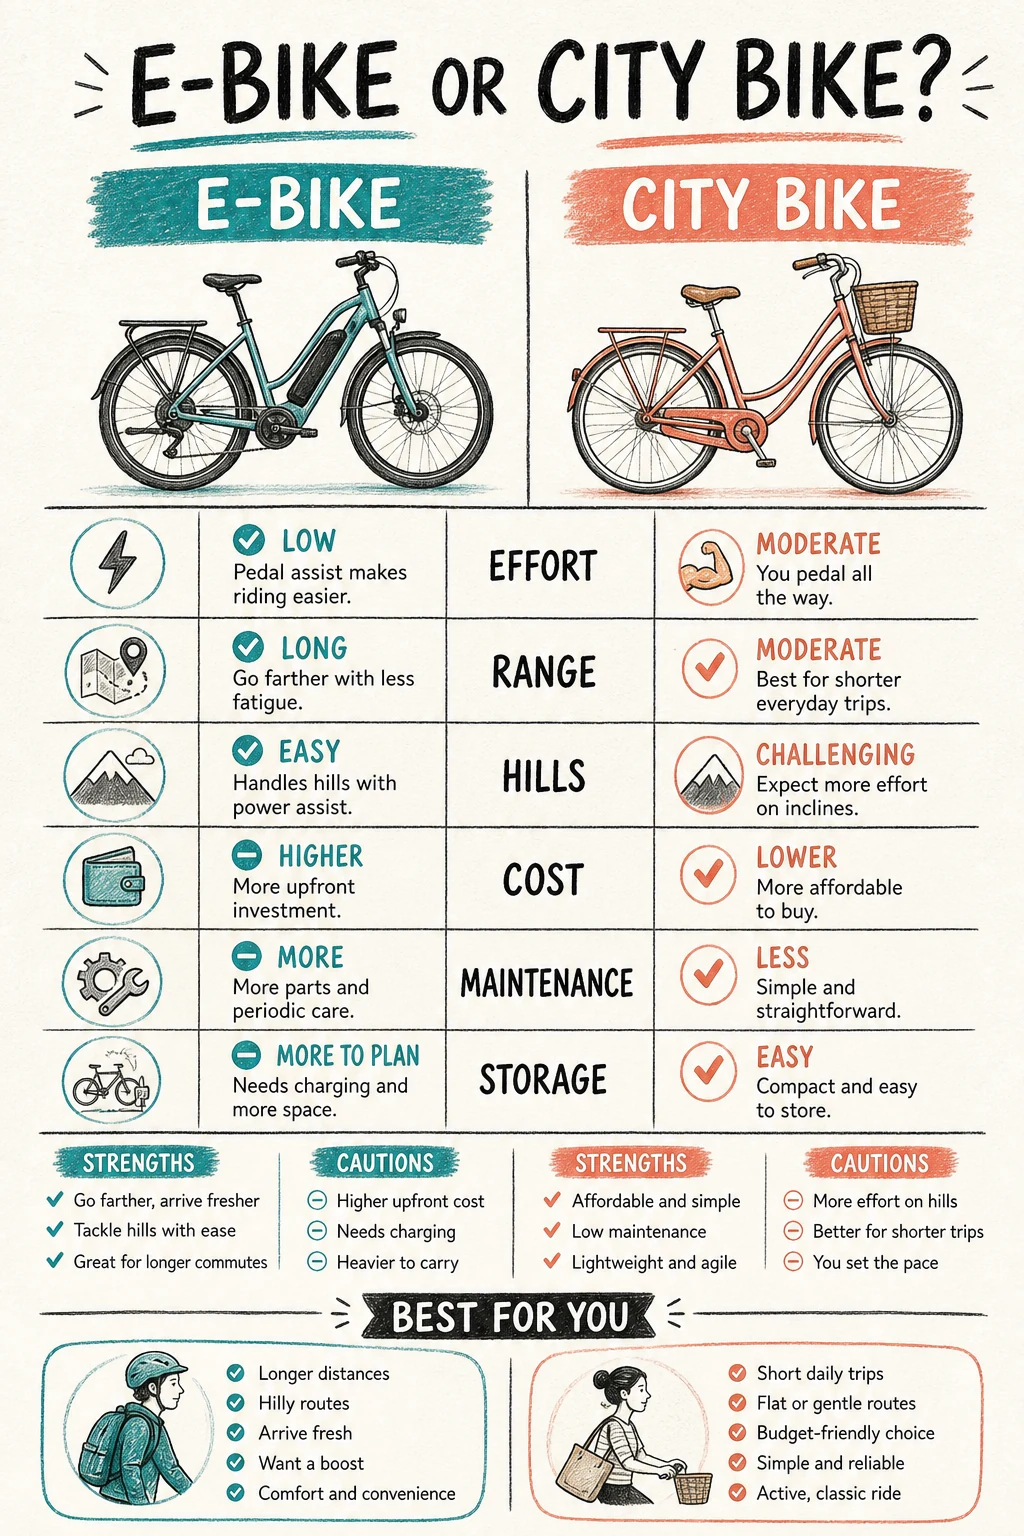
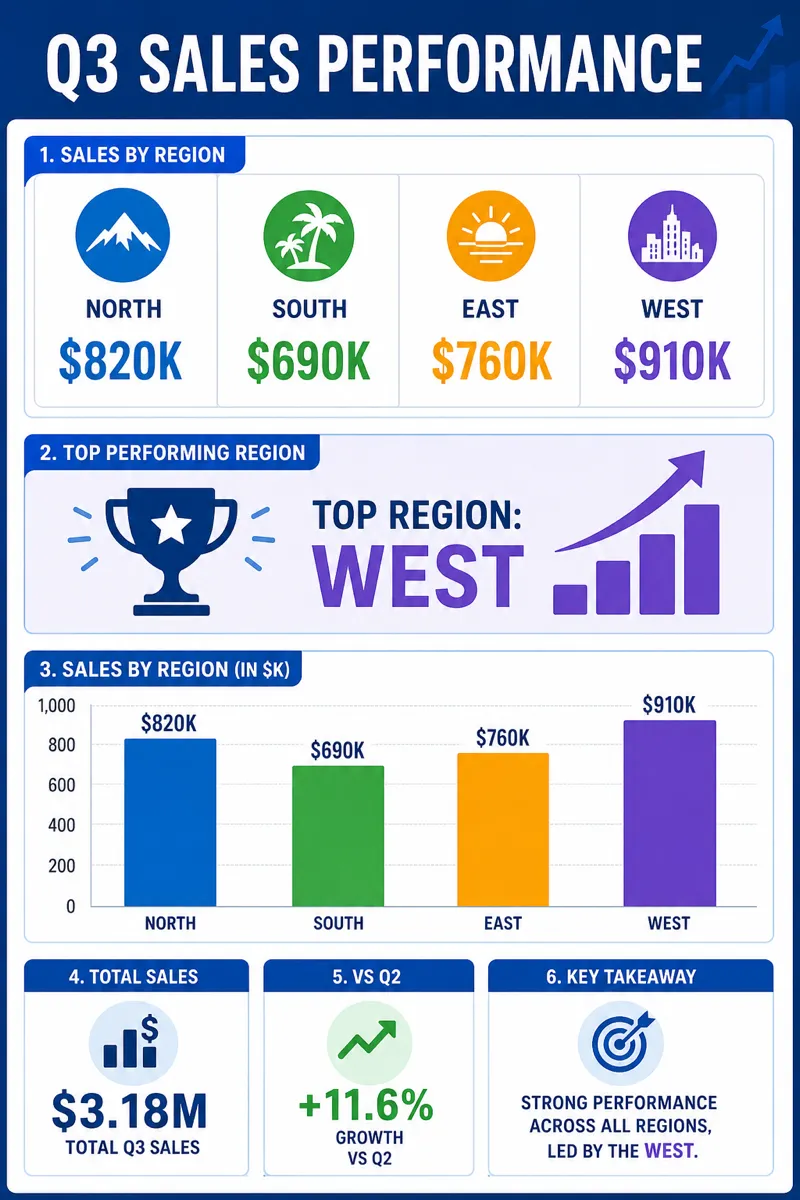
Lay out products, plans, or options side by side so differences are easy to scan. Refine the categories, colors, and emphasis after the first version is generated.
Present experience, skills, and selected achievements in a one-page visual resume. Adjust the hierarchy and wording for a specific role without rebuilding the layout by hand.
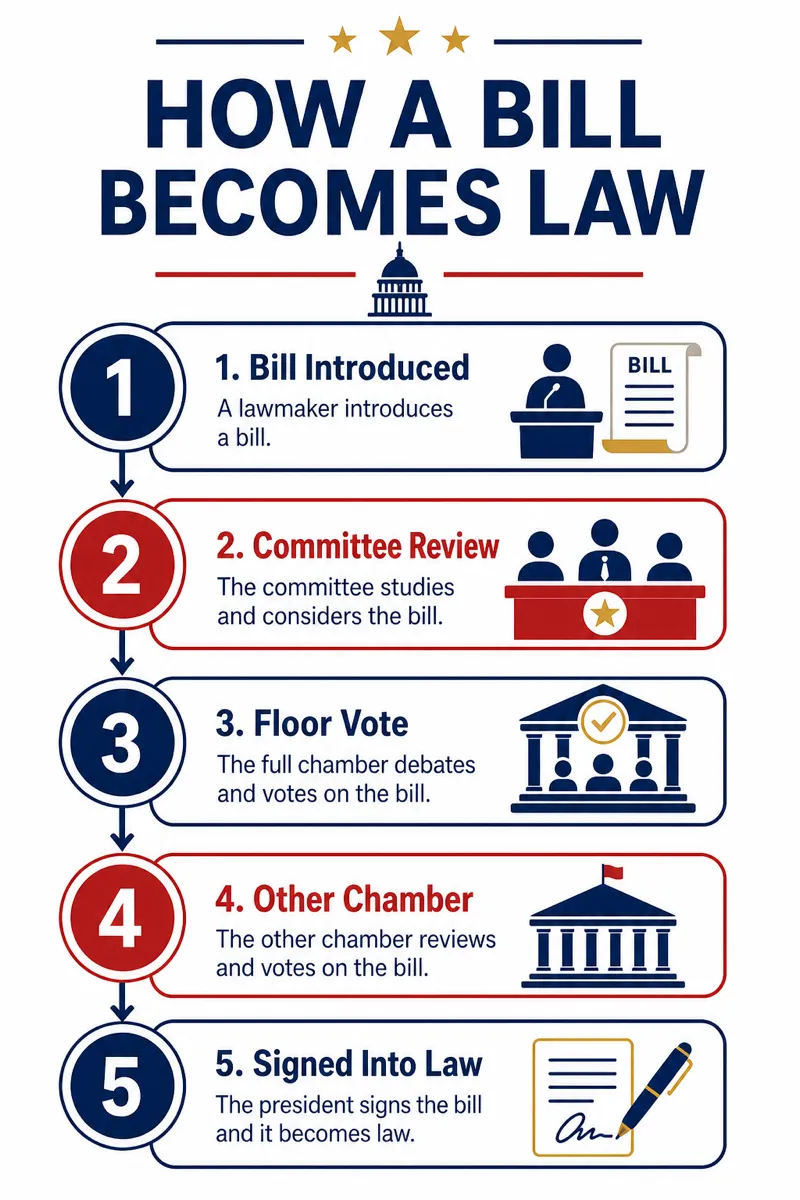
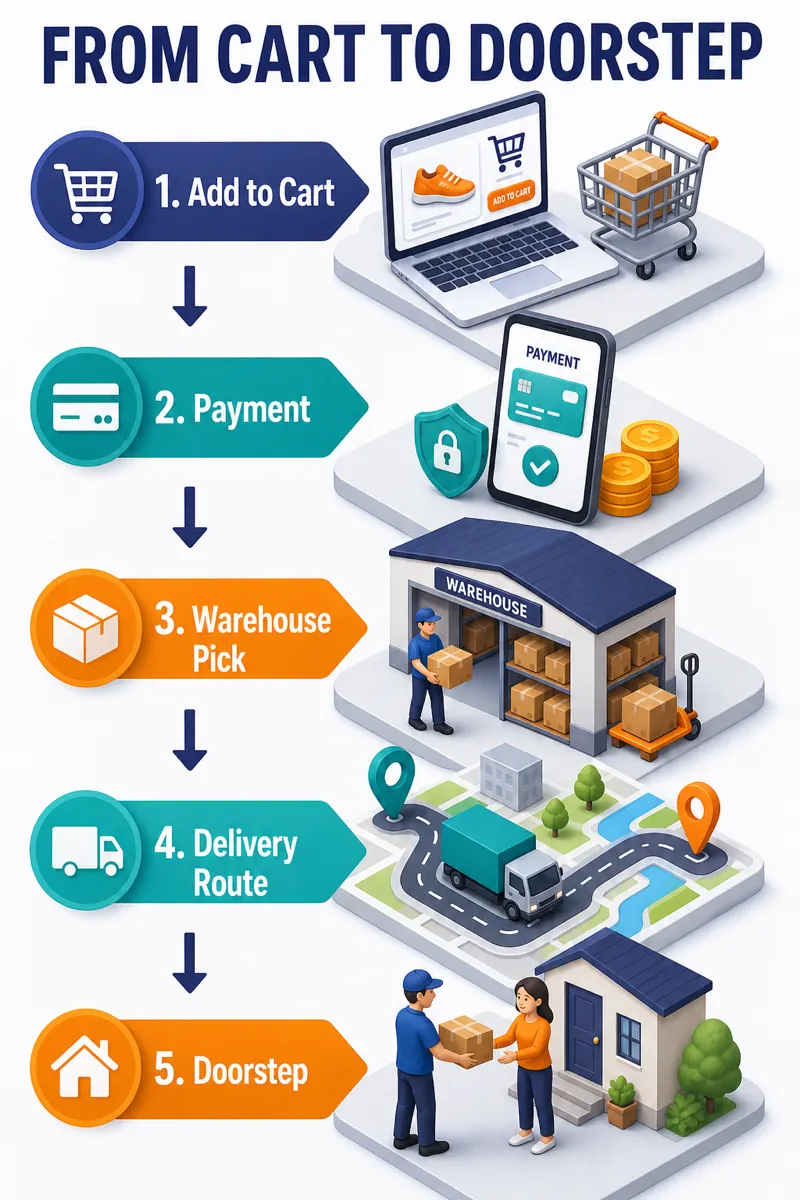
Explain a process, workflow, or decision tree with connected steps and clear branches. Follow up with instructions to simplify a path, rename a node, or change the orientation.
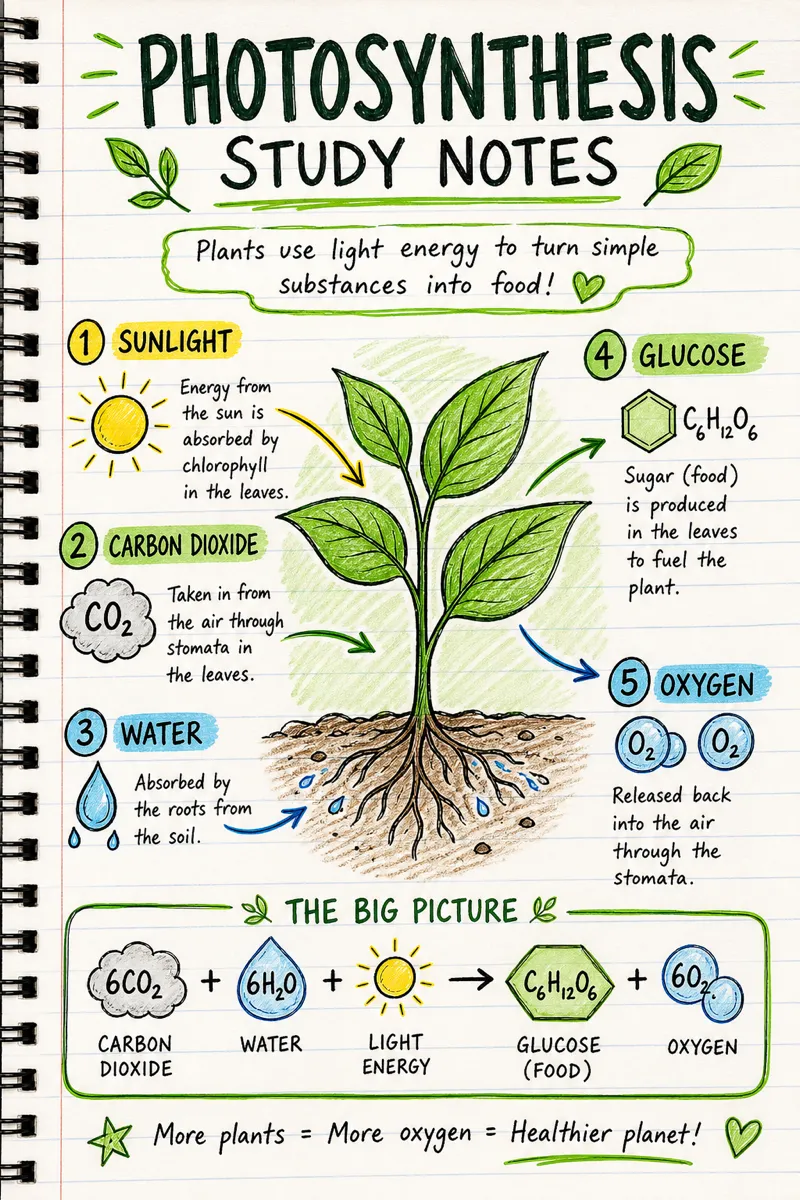
Organize brainstorming sessions, study notes, or research themes around one central idea. Add missing branches or regroup related points by describing the change in plain language.
Show teams, roles, and reporting lines in a structure new hires and stakeholders can understand. Update names, departments, or hierarchy as the organization changes.
Turn research variables, mechanisms, and proposed relationships into a visual model, then verify every label and connector against your source notes.
Turn a paper's central finding into one clear visual summary for journals, preprints, and conference posters.
Working from a NotebookLM summary? Browse our NotebookLM infographic prompts and the NotebookLM style library.
One image, generated or edited, costs 10 credits. Start free with 10 credits, then upgrade to a monthly plan or a one-time credit pack.
Free
For trying it out.
Starter
For regular use.
Pro
For heavy creators.
Credit pack
200 credits, one-time. Never expires.
WeChat Pay is available with HKD.
Everything you need to know before getting started.
Describe an idea, generate it in about a minute, and refine it until it looks exactly right.