
Free conceptual framework maker
Create a conceptual framework from pasted research notes, then refine the labels, relationships, colors, and layout with follow-up instructions.
Sign in, new accounts get 10 free credits.
What can a conceptual framework look like?
How it works
Start from a text prompt, choose the shape and style, and generate a complete infographic. Then ask for specific changes to the wording, colors, or layout until the result is ready to use.
- 01
Describe
Write what you want in plain language — the topic, the facts, the vibe.
- 02
Generate
Get a polished infographic in about a minute, in the aspect ratio you picked.
- 03
Refine
Change colors, wording, or layout with simple instructions — every version is kept.
How do you make a conceptual framework for research?
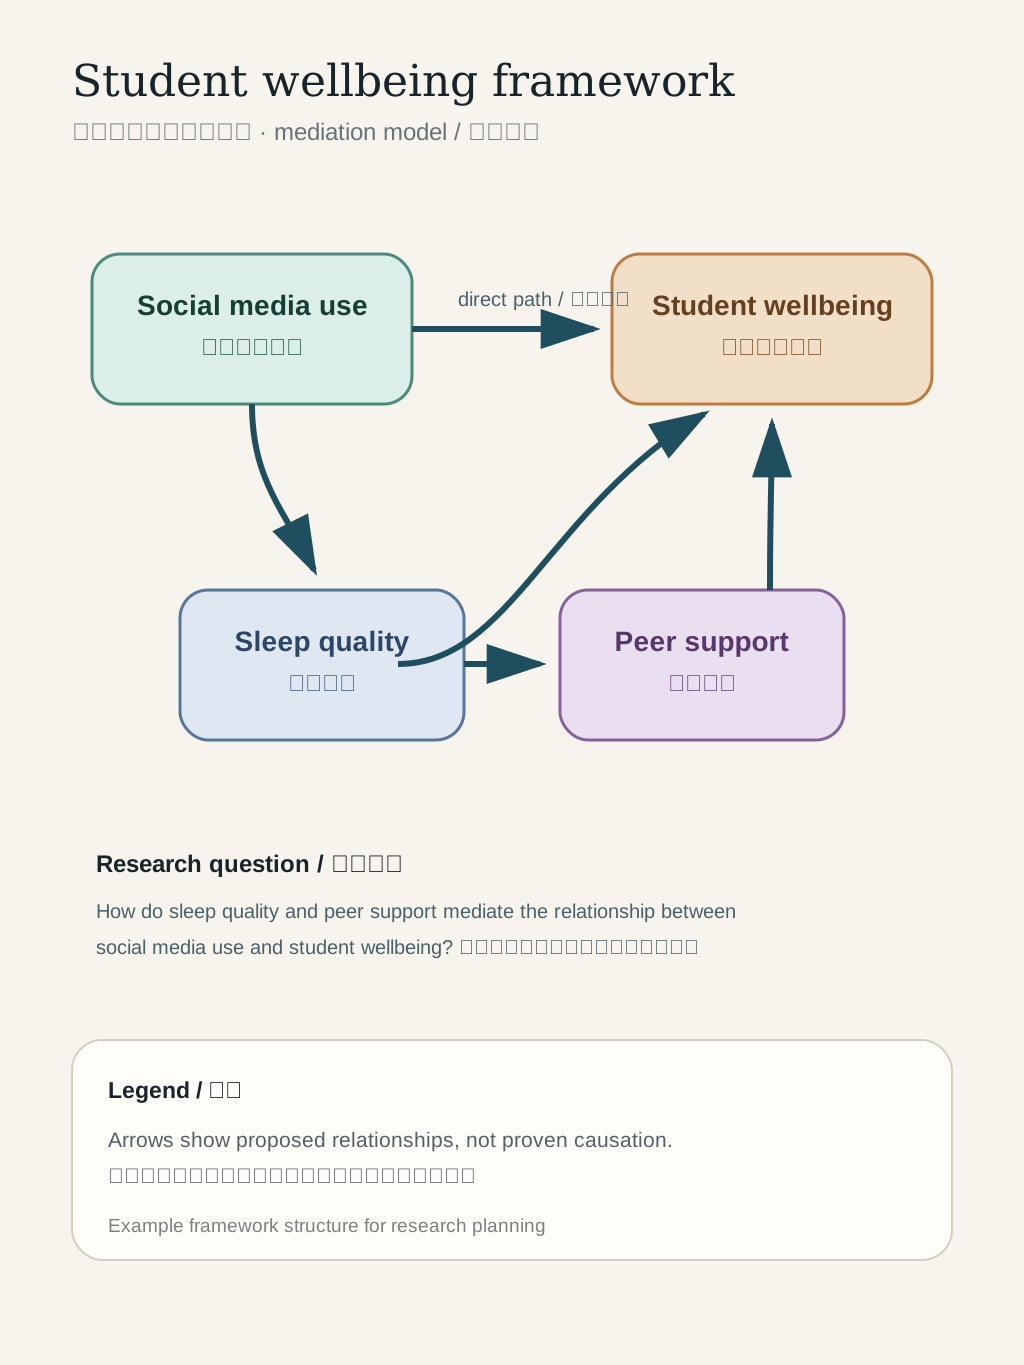
A conceptual framework turns a research question into a visible model of the concepts you plan to study and the relationships you expect to examine. Begin with the problem or outcome, then list the independent variables, dependent variables, mediators, moderators, context, and assumptions that actually appear in your proposal. Paste those notes into the generator in plain text. State which relationships are supported by prior literature and which are hypotheses. This creates a more useful first draft than asking the AI to invent a complete framework from only a topic.
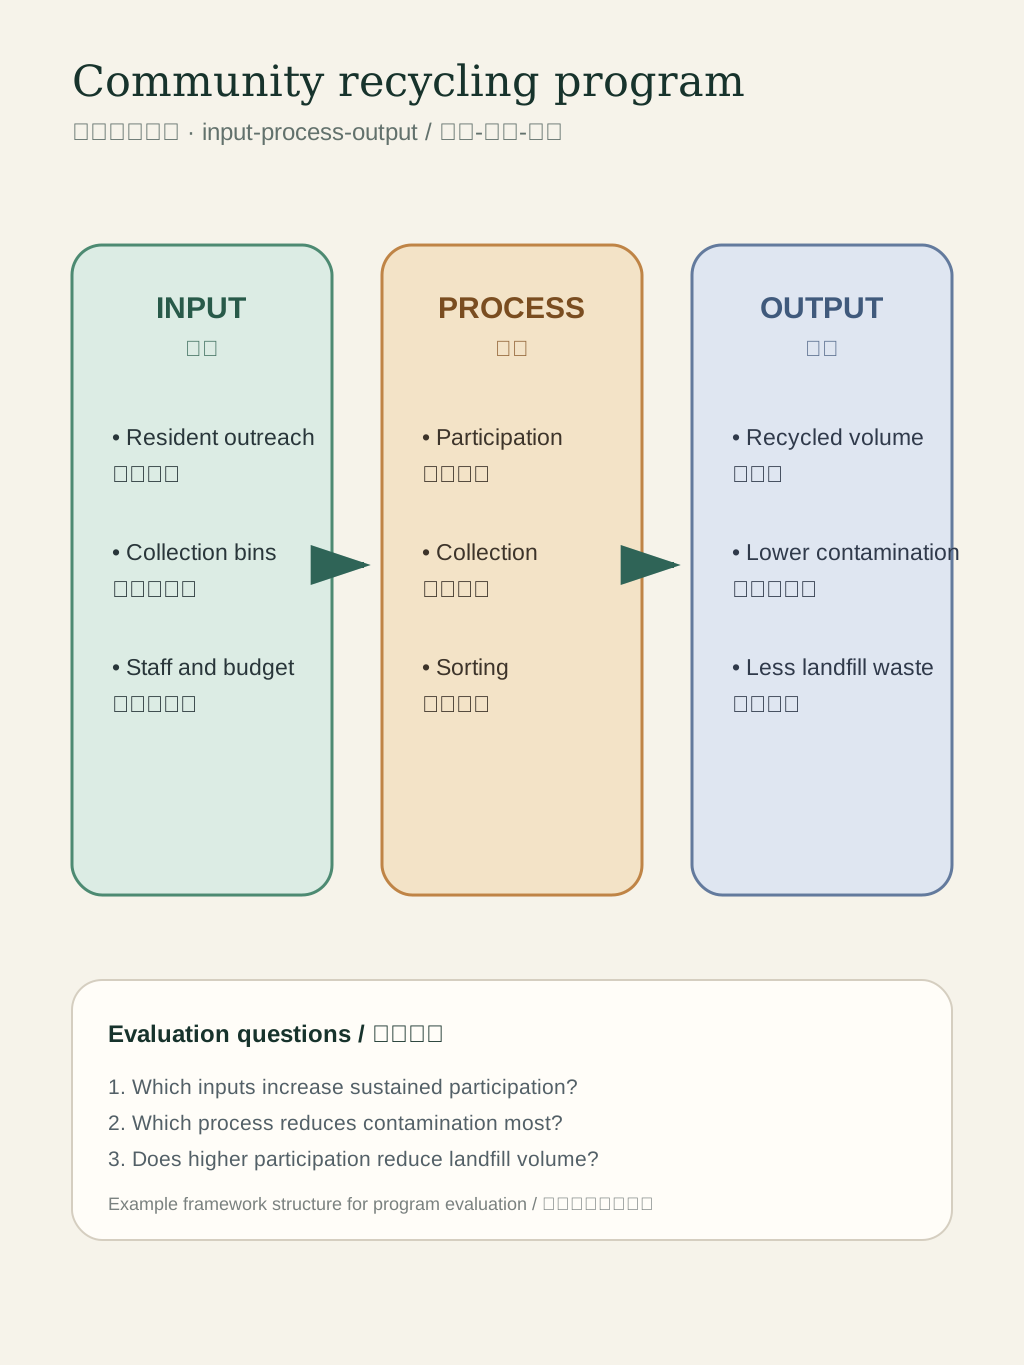
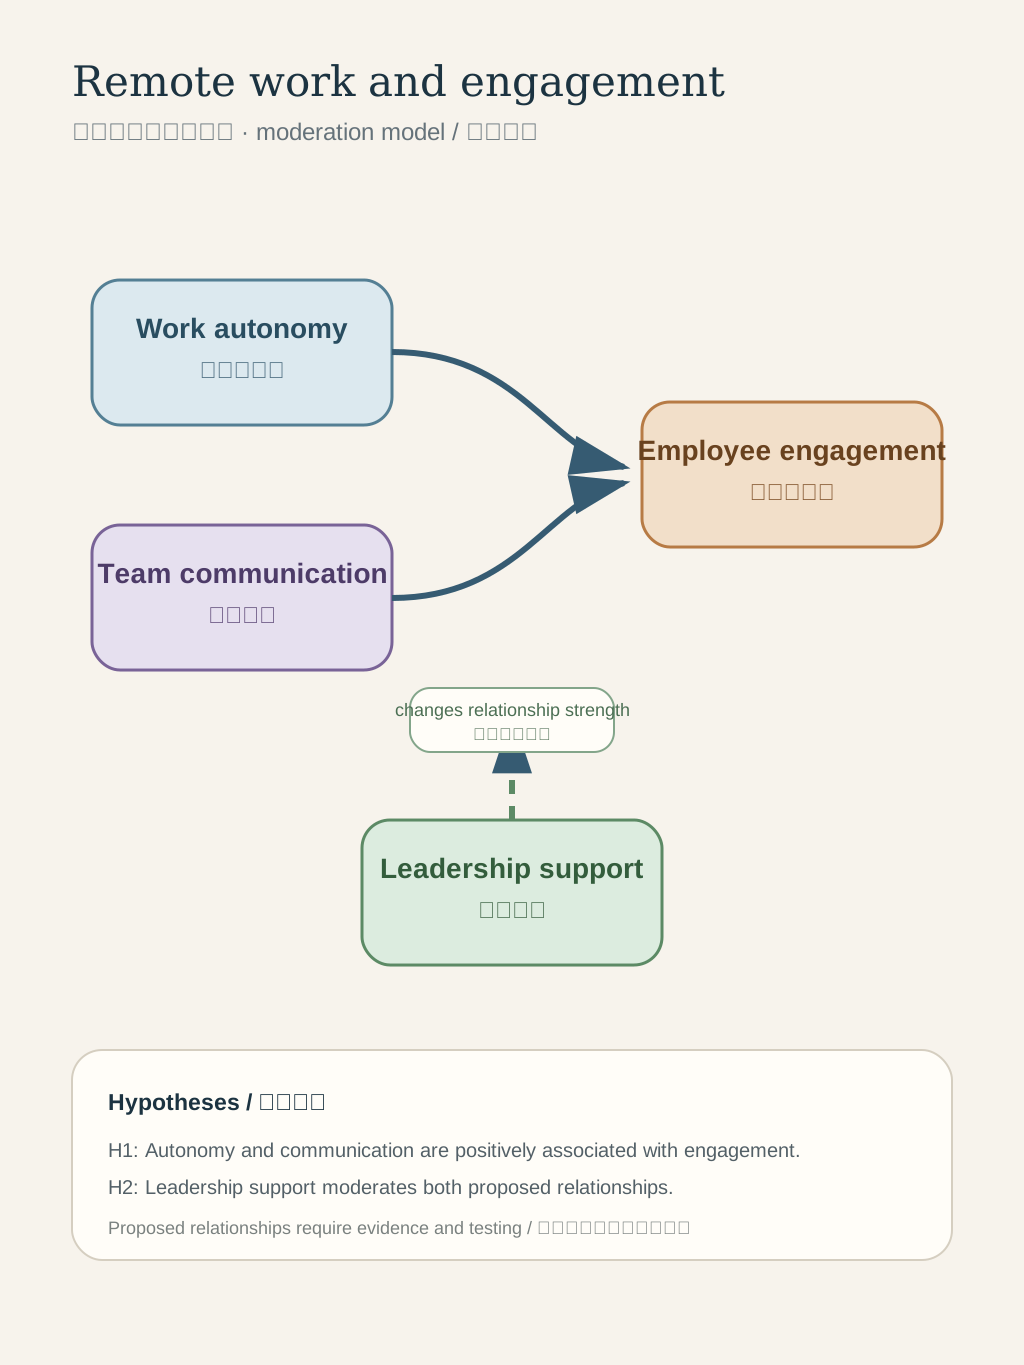
Choose a structure that matches the argument. A simple cause-and-effect model may need two columns and directional arrows. An input-process-output framework needs three clearly separated stages. A theory-led model may place the central construct in the middle, with mechanisms on one side and outcomes on the other. Keep labels short, use one term consistently, and describe each arrow in the prompt. If a relationship is correlational rather than causal, say so. The generated image is a visual draft, not evidence that the proposed relationships are academically valid.
After generation, compare every label and connector with your research notes. Use follow-up instructions to correct wording, remove unsupported links, change the reading direction, or make one variable more prominent. You can ask for a formal monochrome figure for a proposal, a classroom-friendly version for teaching, or a compact landscape version for a slide. Infolustra produces an image from pasted text rather than an editable vector canvas, so keep the source model in your notes and verify the final figure before publication. Cite the theories and studies in the surrounding document instead of asking the image to supply references. This review step matters most for research, where a polished diagram can still contain a misleading arrow or an overgeneralized label.
What can you create with a conceptual framework maker?
Use these starting points to turn a specific research model into a visual draft. Replace the example variables with the terms from your own literature review.
- A thesis model connecting an intervention, a mechanism, and a measurable outcome.
- An input-process-output framework for a program, service, or classroom activity.
- A mediator model showing how one factor may influence an outcome through another factor.
- A moderator model showing when or for whom a proposed relationship may change.
- A mixed-methods research map linking quantitative variables with qualitative themes.
- A literature review synthesis grouping theories, constructs, evidence, and unresolved gaps.
- A public health framework connecting context, behavior, access, and health outcomes.
- An education research framework linking teaching practices, learner conditions, and achievement.
Questions about this format
Make your first infographic
Describe an idea, generate it in about a minute, and refine it until it looks exactly right.